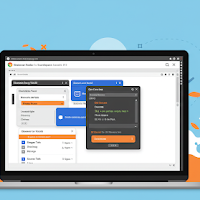
For anyone who builds, designs, or manages websites, Browser Developer Tools (or "DevTools") are the single most powerful asset in your arsenal. Built into every modern browser like Chrome, Firefox, and Edge, this suite of tools is like an MRI for a webpage, allowing you to inspect, debug, and manipulate its code in real-time. But for many, it remains an intimidating black box of cryptic tabs and panels. This guide will demystify the essentials and share some powerful tips and tricks to supercharge your workflow.
Elements Panel
This is your live-action HTML and CSS editor. It shows you the page's structure and the styles being applied to every element, allowing you to experiment with changes on the fly without ever touching your source code.
Live CSS Editing
Simply find an element in the HTML tree, and its corresponding styles will appear in the "Styles" pane. You can then click on any property or value to change it. Want to see if a button looks better in blue? Just type "blue" and see the result instantly. This is invaluable for rapid prototyping and debugging visual issues.
Pro-Tip: Simulating Element States
Ever struggled to inspect the styles of a dropdown menu that disappears when you move your mouse? In the Styles pane, click the :hov button to force an element into a specific state, like :hover, :active, or :focus. This freezes the element in that state, allowing you to inspect and edit its styles with ease.
Console Panel
If the Elements panel is the visual editor, the Console is the command line for your webpage. It's a powerful JavaScript environment where you can log information, debug scripts, and interact with the page programmatically.
Beyond `console.log()`
While console.log('Hello, world!') is the go-to for simple debugging, the console can do so much more. You can use it as a powerful calculator, run JavaScript commands, and inspect complex data structures.
// Instead of logging a complex array of objects...
console.log(users);

// ...try this for a clean, sortable table view.
console.table(users);
Pro-Tip: The Magic Selectors
Tired of writing long document.querySelector() commands? The console has built-in shortcuts:
- $('css-selector') is a shortcut for document.querySelector().
- $$('css-selector') is a shortcut for document.querySelectorAll(), returning an array of all matching elements.
Network Panel
This panel is your window into everything the browser requests from the internet to build the page. It shows every image, script, stylesheet, and data request, along with how long each one took to load. It's essential for diagnosing performance bottlenecks.
The Waterfall Chart
The main view in the Network panel is the "waterfall," which visualizes the loading process. Long bars indicate slow-loading resources. You can filter by type (e.g., Images, JS) to hunt down what's slowing down your page.
Pro-Tip: Simulate Slower Connections
Your website might be fast on your office Wi-Fi, but how does it perform for a user on a slow 3G connection? The Network panel has a "Throttling" dropdown that lets you simulate various network speeds. This is crucial for understanding the real-world performance of your site and optimizing for all users.
Beyond the Basics
While the Elements, Console, and Network panels are the "big three," DevTools offers even more. The Lighthouse panel can run automated performance, accessibility, and SEO audits. The Application panel lets you inspect browser storage like cookies and Local Storage. The journey of mastering DevTools is a long one, but each new trick you learn will pay dividends in your efficiency and understanding of the web.


